Metrics & Charts
Introduction: Passive vs Active Metrics
This page describes the main metrics collected and displayed in the web interface as charts.
Let's start by dividing the metrics collected by OpenWISP Monitoring in two macro categories:
metrics collected actively by OpenWISP: these metrics are collected by the Active Checks;
metrics collected passively by OpenWISP: these metrics are sent by the OpenWrt Monitoring Agent installed on the network devices and are collected by OpenWISP via its REST API.
Device Status
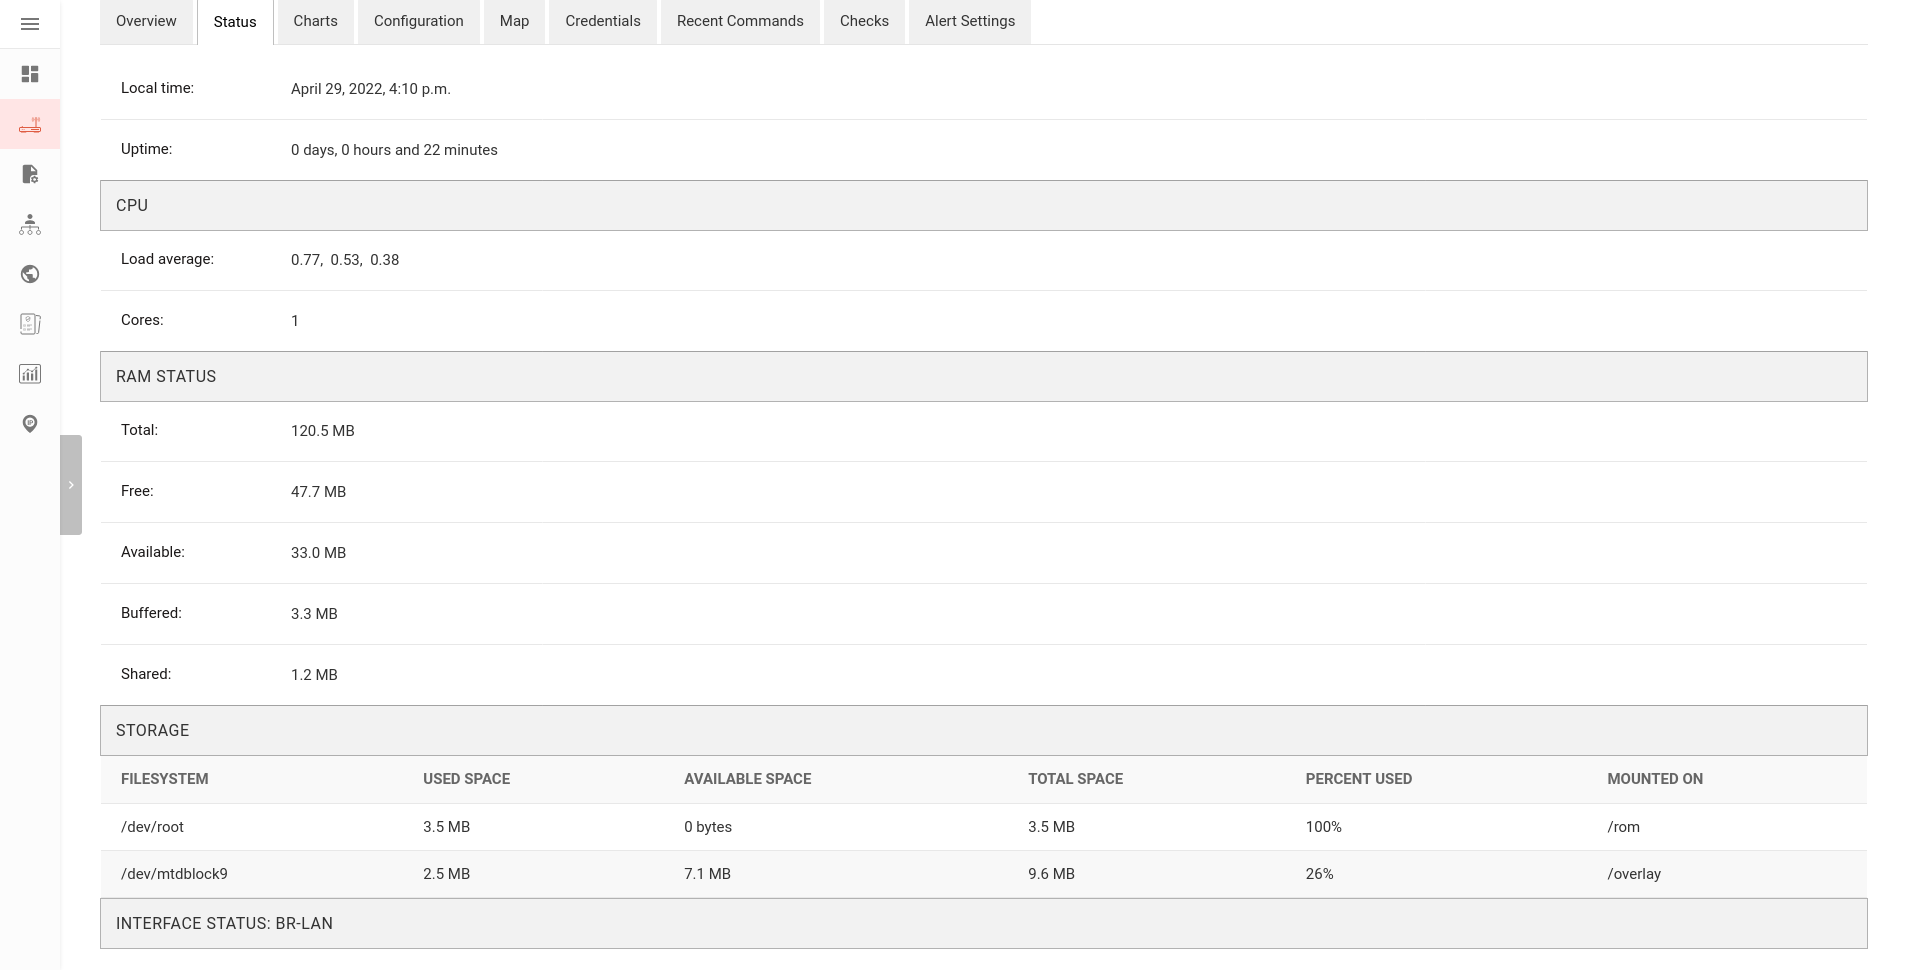
This metric stores the current status of the device for viewing purposes.
Collected via: OpenWrt Monitoring Agent.

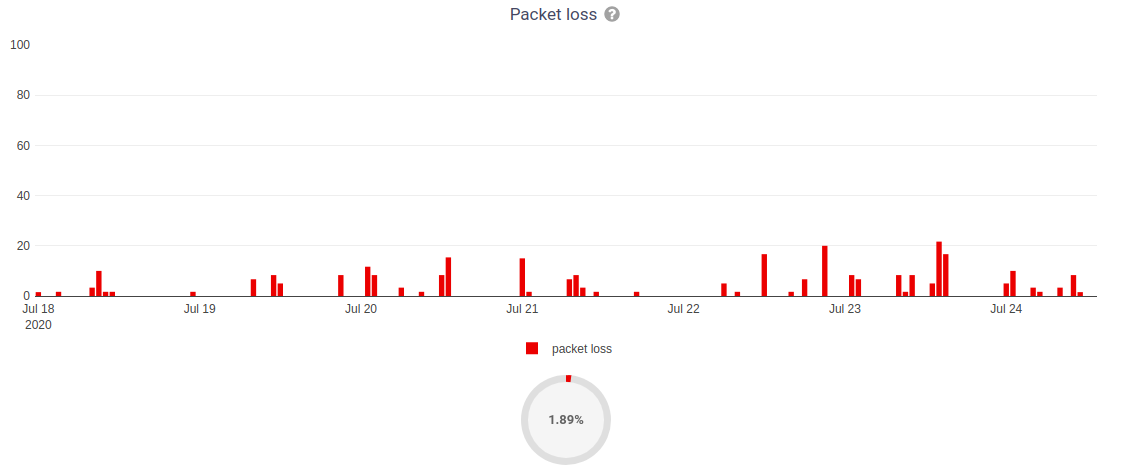
Ping
Ping Success Rate:

Packet loss:
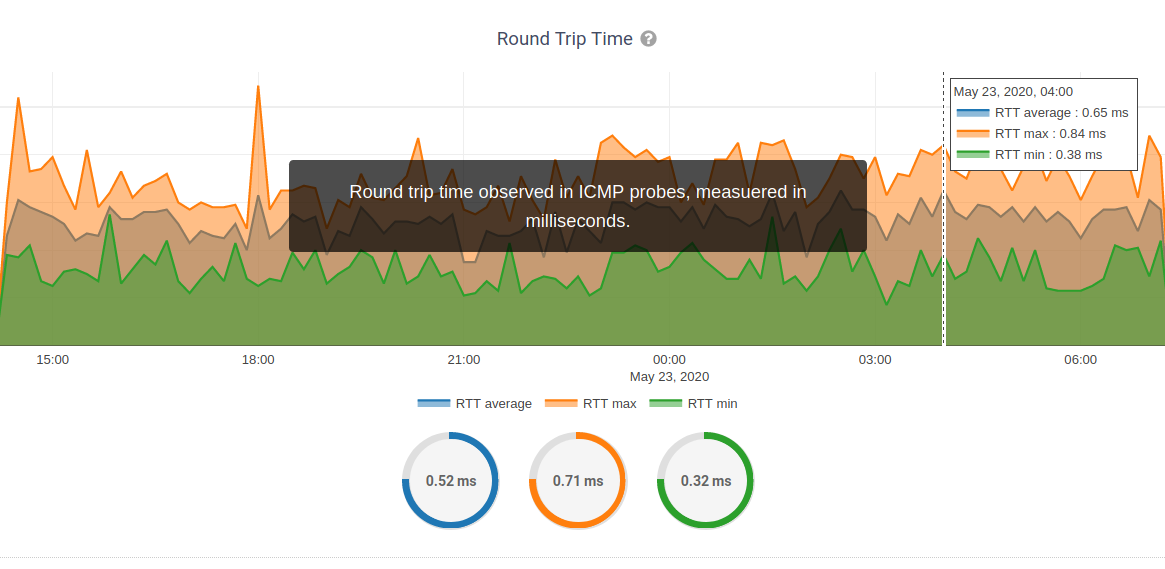
Round Trip Time:
collection: |
|
alert: |
|
measurement: |
|
types: |
|
fields: |
|
configuration: |
|
charts: |
|
Traffic

collection: |
|
measurement: |
|
type: |
|
fields: |
|
tags: |
|
configuration: |
|
charts: |
|
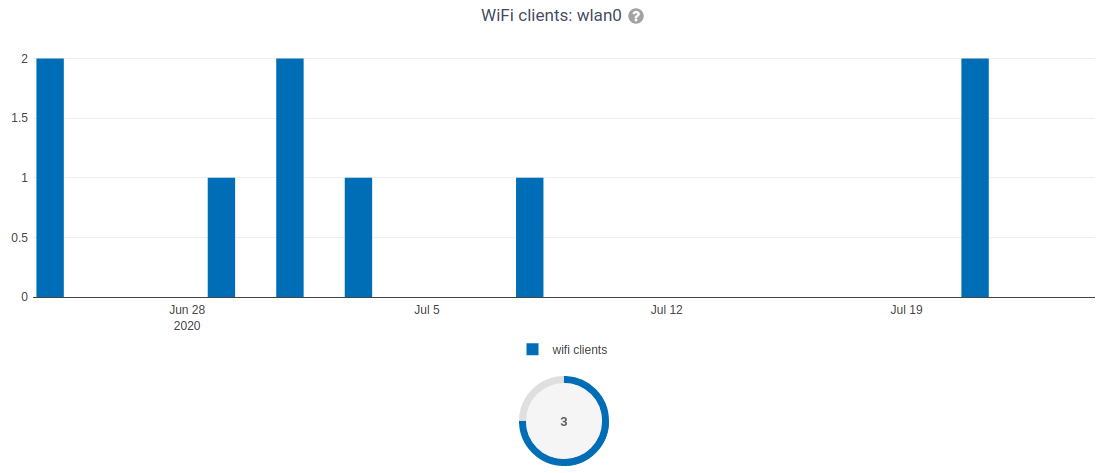
WiFi Clients
collection: |
|
measurement: |
|
type: |
|
fields: |
|
tags: |
|
configuration: |
|
charts: |
|
Memory Usage

collection: |
|
alert: |
|
measurement: |
|
type: |
|
fields: |
|
configuration: |
|
charts: |
|
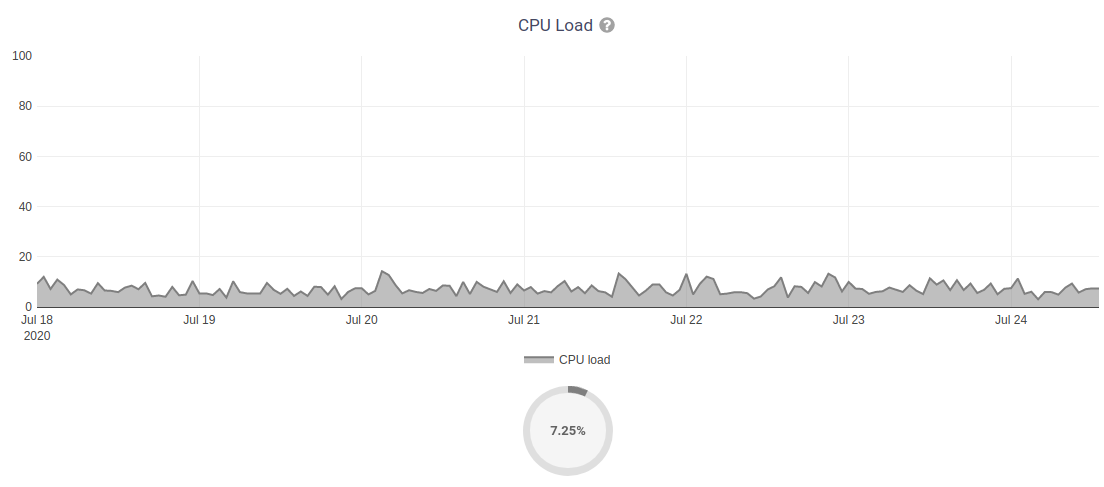
CPU Load Averages
collection: |
|
alert: |
|
measurement: |
|
type: |
|
fields: |
|
configuration: |
|
charts: |
|
Disk Usage

collection: |
|
alert: |
|
measurement: |
|
type: |
|
fields: |
|
configuration: |
|
charts: |
|
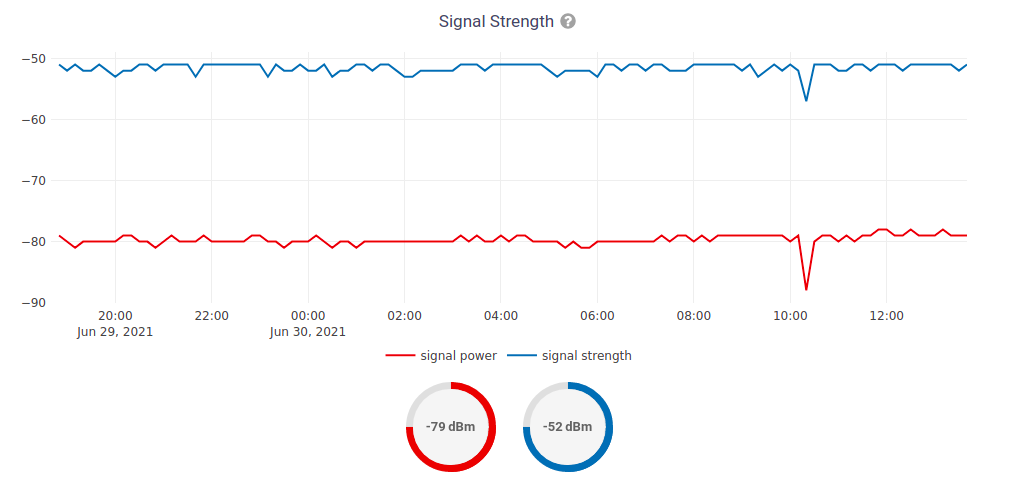
Mobile Signal Strength
collection: |
|
measurement: |
|
type: |
|
fields: |
|
configuration: |
|
charts: |
|
Mobile Signal Quality
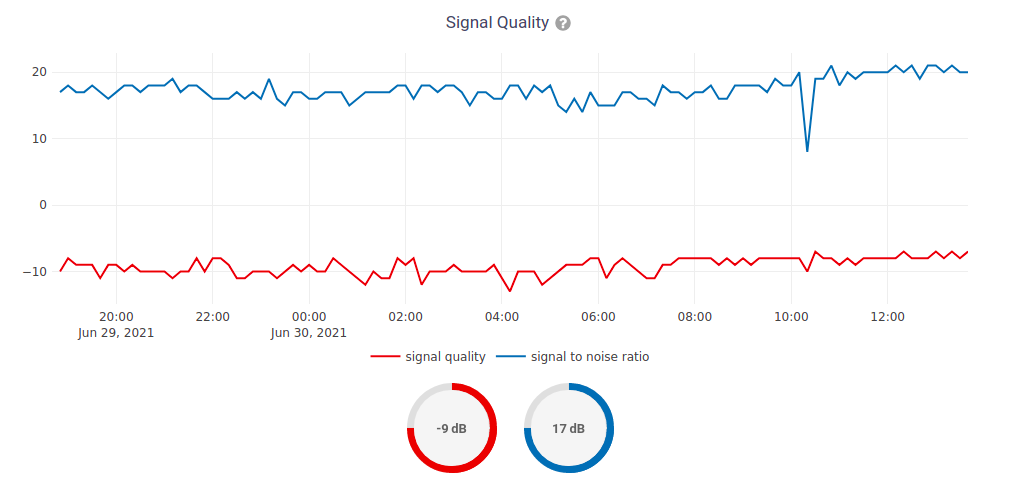
collection: |
|
measurement: |
|
type: |
|
fields: |
|
configuration: |
|
charts: |
|
Mobile Access Technology in Use
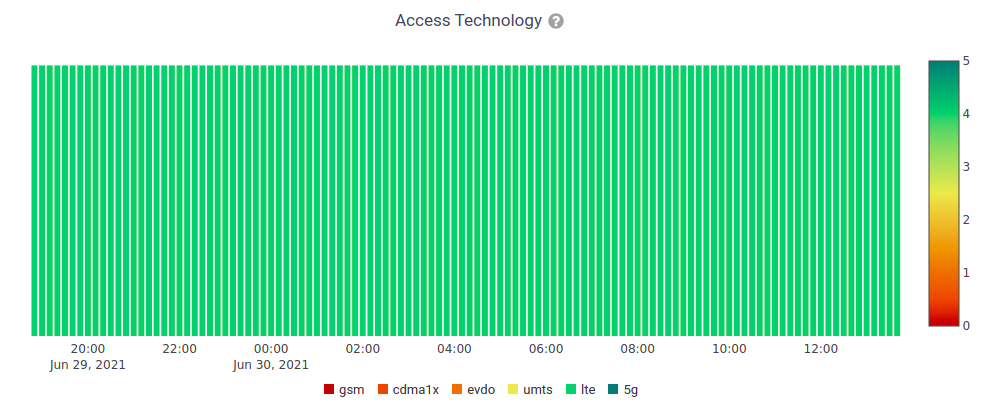
collection: |
|
measurement: |
|
type: |
|
fields: |
|
configuration: |
|
charts: |
|
Iperf3
Bandwidth:

Transferred Data:

Retransmits:

Jitter:

Datagram:
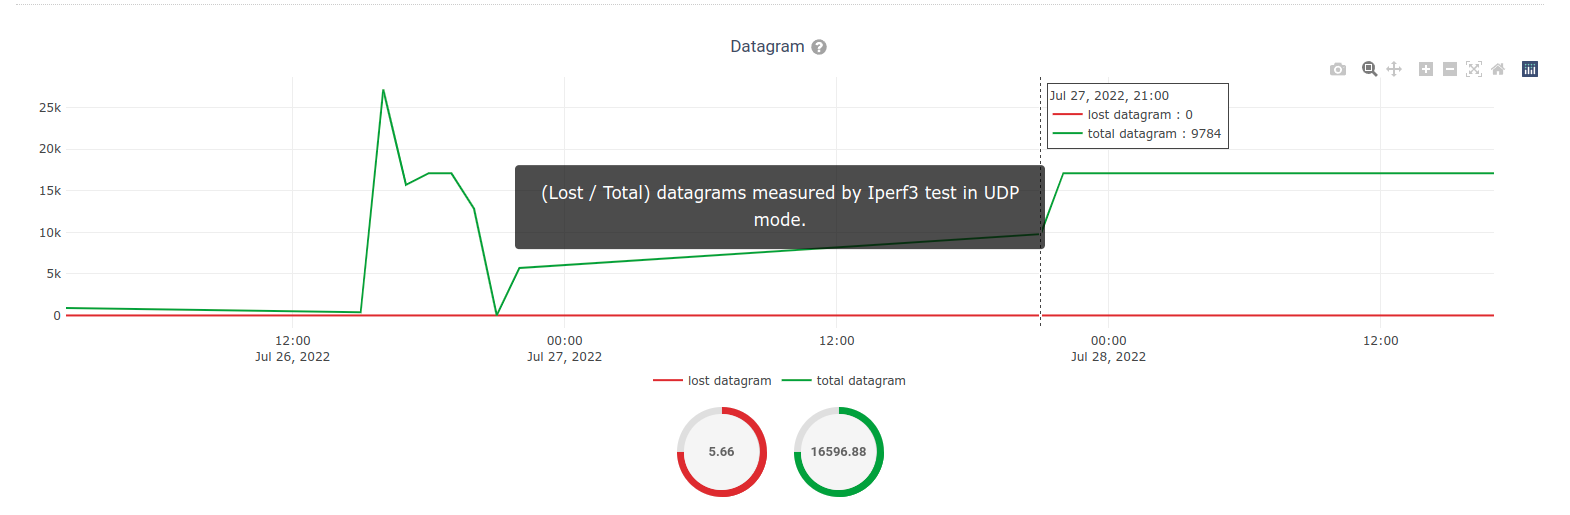
Datagram loss:

collection: |
|
measurement: |
|
types: |
int (iperf3_result, sent_bytes_tcp,
received_bytes_tcp, retransmits, sent_bytes_udp,
total_packets, lost_packets),float (sent_bps_tcp, received_bps_tcp,
sent_bps_udp, jitter, lost_percent) |
fields: |
iperf3_result, sent_bps_tcp,
received_bps_tcp, sent_bytes_tcp,
received_bytes_tcp, retransmits,sent_bps_udp, sent_bytes_udp, jitter,
total_packets, lost_packets,
lost_percent |
configuration: |
|
charts: |
|
For more info on how to configure and use Iperf3, please refer to Configuring Iperf3 Check.
Note
Iperf3 charts uses connect_points=True in default chart
configuration that joins it's individual
chart data points.